Portable Interactive Plotting
Python with Javascript Sprinkles
Wesley Banfield & Steve Purves
Disclaimer
I am by no means a pro here so there are bound to be lots of things overlooked. This is just a collection of some recent experimentations that I though could/would be useful.
Contents
- Why do we need interactivy?
-
What does adding
Sprinkles of JavaScript acheive? - Ok so how does all that work?
- Examples!
- Argh! That didn't work
The call of Interactive Graphing
-
 - Limited Visulaizations
- Hard to Analyse
- Static
- Cumbersome to change -
 - Lags
- Hard to Analyse
- Static
- Cumbersome to change -
- Less code / iterations
- Easier Explorations
But how do we collaborate?
Sharing Methods → Jupyter
Sharing Methods
- Passing a notebook file around
-
Need a notebook server
Can need to rerun → not reproducible + needs dataIt is possible to embed widget state with JupyterLab Settings → Save Widget State Automatically
- Jupyter → Export as ...
- Exports whole notebook
-
No Backend
-
Basic interactivity works
Matplotib widgets don't seem to work for example
-
No
Complex interactivity
-
Basic interactivity works
So why use Python + javascript?
-
Export graphs rather than notebooks - Portable complex interactivity
-
Standalone graphs that run everywhere
- Presentations
- Documents
- (Static) Websites
-
Standalone graphs that run everywhere
- Reproducible graphs
-
Custom Interactivity
How do we add custom interactivity in standalone file?
- Some (Most? All?) Interactive Python libraries are javascript backed
- Complex interactivity generally occurs through relying on Python to update data
-
What if those changes could be made in JavaScript?
- Pure Maths
- Inject precomputed data
Most interactive graphing tools are somehow based on JavaScript but still rely on a python backend for more flexible complex compute (and generally default to this when availible?)
These libraries generally provide a method for creating the div and scripts associated which we can harness and modify
Examples
-
Pure Javascript
- Plotting Wavelets
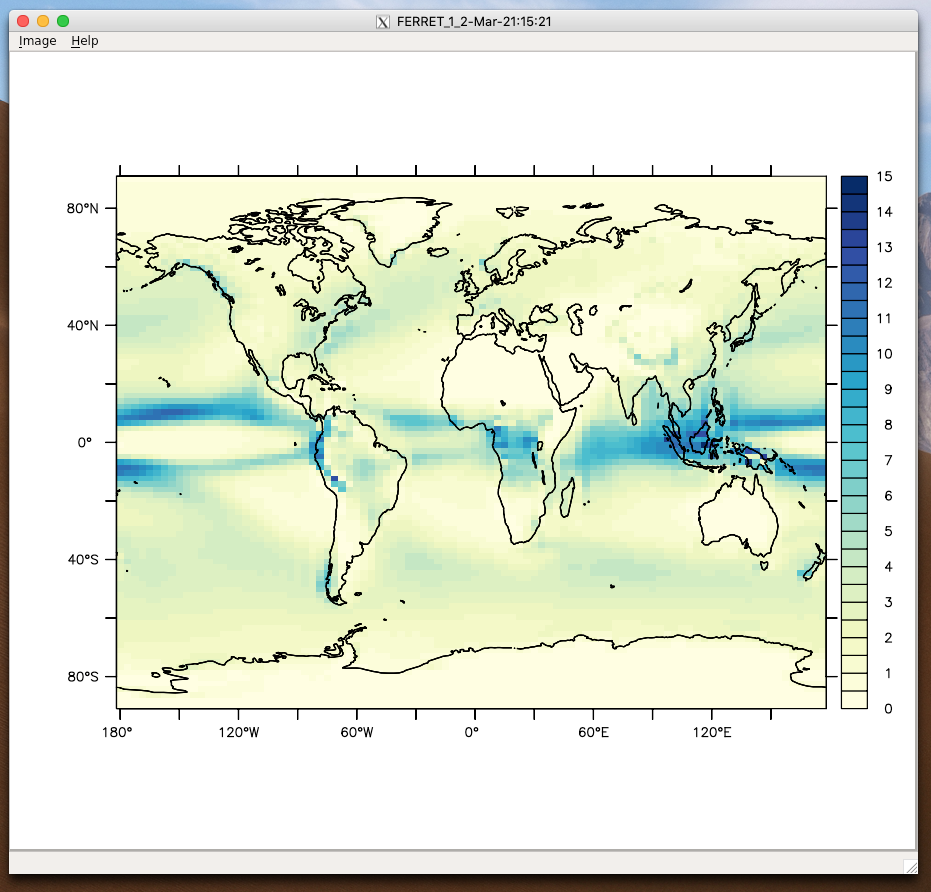
- Plotting Maps
-
Embedding state inside objects
- Plotting maps
- Complex Wavelets (python computed)
- Numpy arrays (Wedges example)
- Getting JavaScript on page
- Ipywidgets
- K3D
- Other Libraries - Plotly
Pure JavaScript
Bokeh
Built in functionality- Create `ColumnDataSource` that holds the data
- Create a plot
- Add Callback
Functions
Dieter Werthmüller - Impulse response over resistive halfspace
Functions
							from bokeh.layouts import column
from bokeh.models import ColumnDataSource, CustomJS, Slider, Title
from bokeh.plotting import Figure
import numpy as np
import empymod

time = np.logspace(-3, 1, 301)
epminp = {'src': (0, 0, 0), 'rec': (3000, 0, 0), 'freqtime': time,
          'solution': 'dhs', 'signal': 0, 'verb': 1}
efield = empymod.analytical(res=50, **epminp)

source = ColumnDataSource(data=dict(time=time, efield=efield))

# Create callback
callback = CustomJS(
    args=dict(source=source),
    code="""
        var data = source.data;
        var res = cb_obj.value
        var time = data['time']
        var efield = data['efield']
        var tau = data['tau']
        var off = 3000
        var mu0 = 4*Math.PI*1e-7
        var tau = 0
        var fact1 = 0
        var fact2 = 0
        var fact3 = 0
        for (var i = 0; i < time.length; i++) {
            tau = Math.sqrt(mu0 * Math.pow(off, 2) / (res * time[i]));
            fact1 = res / (2 * Math.PI * Math.pow(off, 3));
            fact2 = Math.pow(tau, 3) / (4 * time[i] * Math.sqrt(Math.PI));
            fact3 = Math.exp(- Math.pow(tau, 2)/4);
            efield[i] = fact1 * fact2 * fact3;
        }
        source.change.emit();
    """
)

# Create slider
slider = Slider(start=1, end=100, value=49, step=1, title="Resistivity (Ohm.m)")

# Attach callback to slider
slider.js_on_change('value', callback)

# Create figure
p = Figure(plot_width=600, plot_height=400, x_axis_type="log",
                       tools='pan,wheel_zoom,box_zoom,reset, hover')

# Plot empymod-responses for QC
for r in [1, 25, 50, 75, 100]:
    epm = empymod.analytical(res=r, **epminp)
    p.line(time, epm, line_color='black', line_width=1)

# Plot interactive JS result
p.line('time', 'efield', source=source, line_width=3, line_alpha=0.6)

p.add_layout(Title(text='Impulse response over a halfspace', align="center"), "above")
p.xaxis.axis_label = "Time (s)"
p.yaxis.axis_label = "Amplitude (V/m)"

# Creaty layout and show
layout = column(p, slider)
Multi-Slider
Arrays
Arrays
						#Open dataset
ds = xr.open_dataset("/Users/wesleybanfield/Downloads/10MaParathetys_v4_topo_fixed_routing_netcdf_flask_app-2.nc")

# Create dictionnary this is what is going to hold the data
d = {}
for data_var in ds.data_vars:
	d[data_var] = [ds[data_var].values]

# Bokeh will only plot one varaible so the "trick" is to modify the values inside that variable inside the javascript callback
d["to_plot"] = [ds[list(ds.data_vars)[0]].values]
# Create the data source that is accesible from inside the javascript
source = ColumnDataSource(d)

# Create the javascript callback
# All we do here is update the values of the varaible "to_plot" with the ones chosen inside the selctor tool
callback = CustomJS(
	args=dict(source=source),
	code="""
	var data = source.data;
	data['to_plot'] = data[cb_obj.value];
	source.change.emit();
""",
							)
Embedding precomputed data
Panel.embed()
panel.save does not work and complains about python callbacks → can't save panel.embed() to file
🤬
Steve's Realtime demos!
Other points of interest
- Plotly
- Ipywidgets doesn't play nice?
Plotly (Generic??)
Post-processing
Not a pro here!!!
Seems like using Dash is the way to go for similar interactivity but not sure how to get that working without a server.
Find someone more appropriate!!!
Seems like using Dash is the way to go for similar interactivity but not sure how to get that working without a server.
Find someone more appropriate!!!
- Create traces / data
-
Plot Data with
output_type='div' - Link custom javascript
Plotly
import plotly.graph_objs as go
from plotly.offline import plot
trace = go.Scatter(
...
)
data = [trace]
# get the a div
div = plot(data, include_plotlyjs=False, output_type='div')
# retrieve the div id (you probably want to do something smarter here with beautifulsoup)
div_id = div.split('=')[1].split()[0].replace("'", "").replace('"', '')
# your custom JS code
js = '''
'''.format(div_id=div_id)
# merge everything
div = div + js